Case Study — 03 of 03
Azure NOC Operations Monitor
A fully automated Network Operations Center (NOC) simulation that generates, sends, and visualizes cloud infrastructure data using Python, GitHub Actions, and Microsoft Azure.
Why I Made This
I had just started getting into cloud engineering and DevOps and found it genuinely interesting. I wanted my first real project in that space to be hands-on rather than just following a guide step by step. Building a telemetry pipeline felt like the right thing to tackle first because it made me work through the full flow, such as writing a script that generates data, automating it on a schedule, keeping credentials out of the codebase, and then actually seeing everything show up in a live Azure dashboard.
Initially this project was supposed to be focused on a system that alerted me about earthquakes in the US if there was one of a large magnitude on the richter scale, and I did managae that by setting up an alert system through the API from earthquake.usgs.gov. I set up a system that would ping my phone AND send me an email the minute a level 7 richter scale eartquake was recorded. Of course this happens rarely, so I tested it by using a richter scale of 2-3 which happens more frequently.
Unfortunately this project ended up getting sidetracked due to my own inexperience and inadequate focus. The moment I tried implementing a telemetry pipeline, I realised that there was no actual data to be used as my free trial subscriptio had just ran out on Azure portal, and they did not offer additional data to free users for these circumstances. So I tried to find other solutions, and ended up forgetting about the initial project since I had already technically considered it as done. My solution was to create a mock-data, which ended up working just fine and was visually acceptable, however I had also created a map that showed a live feed through a map world-wide to display the earthquakes that happened in the selected region. That was lost as it was registered with a trial subscription, so in the end I had no choice but to change the focus to something different such as the telemetry pipeline.
Core Features
Automated Data Pipeline. A GitHub Actions CI/CD pipeline triggers a Python telemetry generator every 15 minutes, pushing simulated cloud infrastructure metrics directly into Azure Log Analytics without any manual intervention.
Hybrid Execution. The Python script intelligently detects if it is running locally in a continuous loop or in the cloud for single execution, adapting its behavior automatically without any configuration changes.
Secure Credentials. All Azure API keys and Workspace IDs are securely managed via GitHub Actions Secrets and injected into the pipeline at runtime. No sensitive values are committed to the repository or exposed in logs.
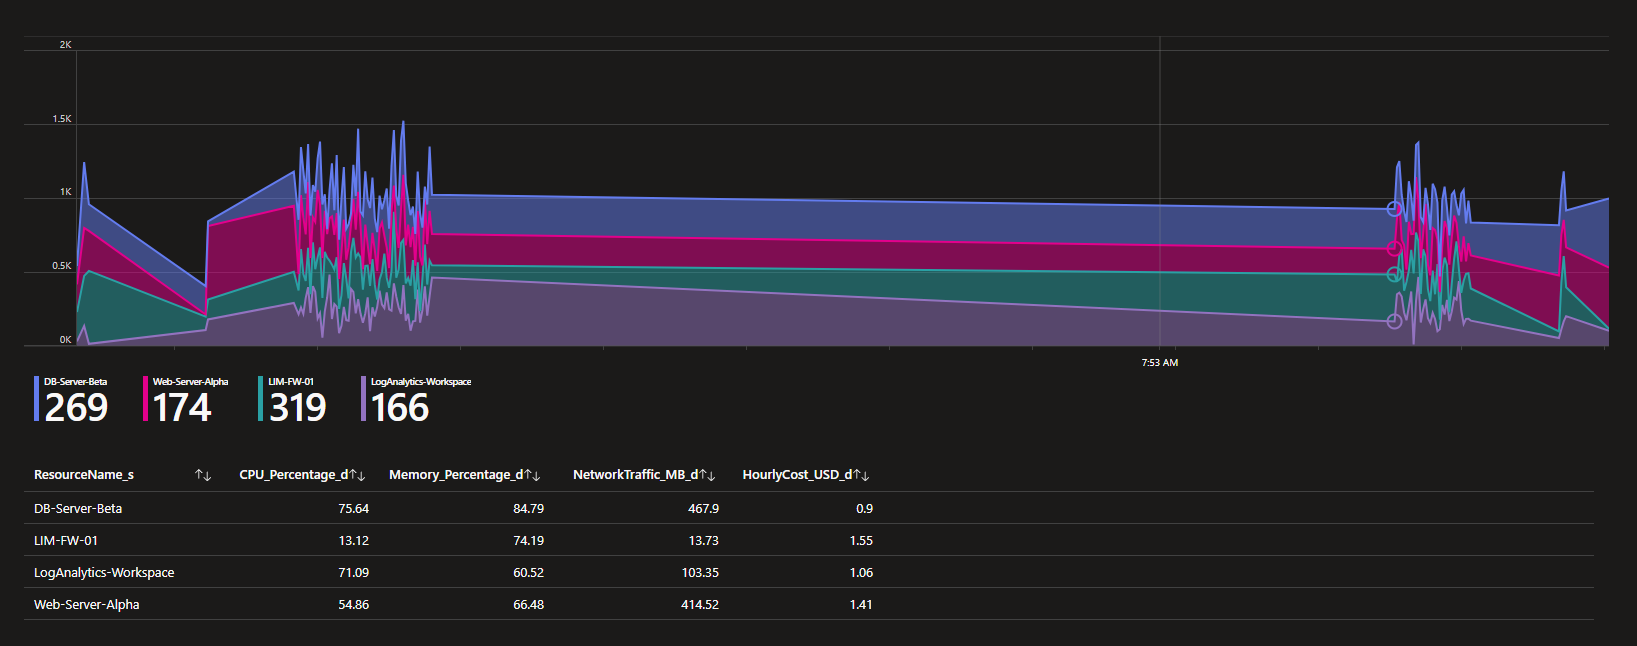
Live Dashboards. The generated data flows into Azure Log Analytics, where custom Kusto Query Language (KQL) queries visualize CPU, Memory, Network Traffic, and Hourly Costs in Azure Workbooks.